4.4 Building Energy
4.4.1 Strategy: Electrification
Building electrification refers generally to the conversion of building systems and appliances that are powered directly by fossil fuels into alternative systems and appliances that are powered by electricity, which is becoming increasingly low-carbon. The primary opportunities for electrification are in suburban areas with old homes that have water and space heating powered by natural gas. Household heating fuel type in Stockton from 2018 ACS 1-Yr data is shown below.
# acs_vars <-
#   listCensusMetadata(
#     name = "2018/acs/acs1",
#     type = "variables"
#   )
#
# save(acs_vars, file="C:/Users/derek/Google Drive/City Systems/Stockton Green Economy/acs1_vars_2018.Rdata")

load("C:/Users/derek/Google Drive/City Systems/Stockton Green Economy/acs1_vars_2018.Rdata")

heating_fuel <-
  getCensus(
    name = "acs/acs1",
    vintage = 2018,
    vars = "group(B25040)",
    region = "place:75000",
    regionin = "state:06"
  ) %>%
  select_if(!names(.) %in% c("GEO_ID","state","place","NAME")) %>%
  dplyr::select(-c(contains("EA"),contains("MA"),contains("M"))) %>%
  gather(
    key = "variable",
    value = "estimate"
  ) %>%
  mutate(
    label = acs_vars$label[match(variable,acs_vars$name)]
  ) %>%
  transmute(
    `Heating Fuel Type` =
      substr(
        label,
        lapply(
          label, function(x){
            max(unlist(gregexpr('!!',x)))+2
          }
        ),
        nchar(label)
      ),
    `Number of Households` = estimate,
    `Percent of Households` = paste0(round(estimate/95557*100,2),"%")
  )

kable(
  heating_fuel,
  booktabs = TRUE,
  caption = 'Heating fuel type for Stockton households. Data from ACS 1-yr, 2018.'
) %>%
  kable_styling() %>%
scroll_box(width = "100%")| Heating Fuel Type | Number of Households | Percent of Households |
|---|---|---|
| Total | 95557 | 100% |
| Utility gas | 62508 | 65.41% |
| Bottled, tank, or LP gas | 535 | 0.56% |
| Electricity | 30237 | 31.64% |
| Fuel oil, kerosene, etc. | 125 | 0.13% |
| Coal or coke | 0 | 0% |
| Wood | 222 | 0.23% |
| Solar energy | 766 | 0.8% |
| Other fuel | 65 | 0.07% |
| No fuel used | 1099 | 1.15% |
\(~\)
The 65% of households with “Utility gas” represent the opportunity to replace space heating systems with electric alternatives like heat pumps, moving those households over to the “Electricity” category currently at 32%. The other households using other fuels like kerosene or biomass represent a very small number, but targeting these households may be particularly important because of the extra cost-effectiveness of electrification, and the likely co-benefits of improving health outcomes for a relatively more low-income and rural population. The California Public Utilities Commission is in the process of piloting projects to “Identify Disadvantaged Communities in the San Joaquin Valley and Analyze Economically Feasible Options to Increase Access to Affordable Energy in those Disadvantaged Communities”. Unfortunately, at least one pilot in California City is moving forward with natural gas infrastructure, seemingly because of bureaucratic issues related to the electricity alternative. We would recommend that the City of Stockton stay actively involved in this CPUC project by providing comments on the upcoming phases and advocating for further pilo ts in Stockton and its peripheral rural areas to involve electrification.
The Rocky Mountain Institute produced a report in 2018 titled “The Economics of Electrifying Buildings”. This report includes Oakland as the most geographically proximate case study with estimates of average annual tCO2e reduction and net $ savings for every household that converts under different initial conditions, which will be modeled for Stockton. Their overall recommendations include:
- Prioritize rapid electrification of buildings currently using propane and heating oil. This is more relevant in East Coast case studies, but the possible benefits to Stockton were described above.
- Stop supporting the expansion of the natural gas distribution system, including for new homes. Our model will consider the impacts of policies to ban natural gas in new buildings. It will be important to learn from the experience of the City of Berkeley which voted to ban natural gas in new buildings in 2019 but is currently facing a lawsuit from the California Restaurant Association.
- Bundle demand flexibility programs, new rate designs, and energy efficiency with electrification initiatives. Stockton should particularly focus on incentives for both creating the local skilled workforce of HVAC contractors, as well as rebates for homeowners. RMI notes: “Heat pump water heaters make up less than 1% of water heater sales today, and their unsubsidized purchase prices are two or more times those of natural gas water heaters. Given the current immaturity of the market for these products, and the potential for significant economies of scale with increasing market share, their costs are likely to decline in the future. The National Renewable Energy Laboratory’s (NREL’s) Electrification Futures Study projects cost declines of 20-38% for air-source heat pumps and 42-48% for heat pump water heaters by 2050. Likewise, in regions where contractors are currently unfamiliar with heat pump products, increasing scale and familiarity may reduce installation costs in the future.” Electrification of specific high-consumption appliances like water and space heaters also may be combined with “smart appliance” capabilities that enable demand response, discussed next.
The following are case studies of electrification incentive programs from other cities. It is notable that none were found that specifically focus on workforce training, which is an opportunity for Stockton to differentiate itself.
- Sacramento Municipal Utility District has an All-Electric Smart Home Program, part of the SMUD Smart Home Program, in which participating homeowners receive the financial incentives for single and multi-family homes shown in the table below. The minimum requirements include: all electric appliances and mechanical systems; no gas line in the home; and no gas service at the property. The public-private partnership has reached more than 1,000 homes and is expected to reach 2,000 by the end of the year.
| Type | Standard Incentive | Induction cooking appliance bonus | Total possible incentives |
|---|---|---|---|
| Single-family unit | $4,000 | $1,000 | $5,000 |
| Multifamily unit | $1,250 | $500 | $1,750 |
- MassCEC provides incentives for residential installation of whole-home air-source heat pumps. Pilot funding for the project is still being allocated so the number of affected homes is not yet recorded. Incentives are based on income category: For >120% of state median income, $2,500; for 80-120%, $3,750; for <80% or affordable housing, $5,000.
- City of Palo Alto Utilities offers rebates with the following eligibility requirements: To participate in the program, you must be a CPAU customer replacing a gas or electric water heater or installing a HPHW in a new or remodeled home; The HPHW must abide by the technical specifications listed by CPAU or must be on the list of Energy Star certified HPHWs.
The City of Palo Alto commissioned a 2016 study by TRC Energy Services which modeled the costs and impact of electrifying air and space gas heaters with heat pumps.
The pasted figure below shows results for their model combining simulations of retrofitting a typical existing single family residential home of either one-story 2,100 or two-story 2,700 sqft in Palo Alto’s climate zone (CZ4).
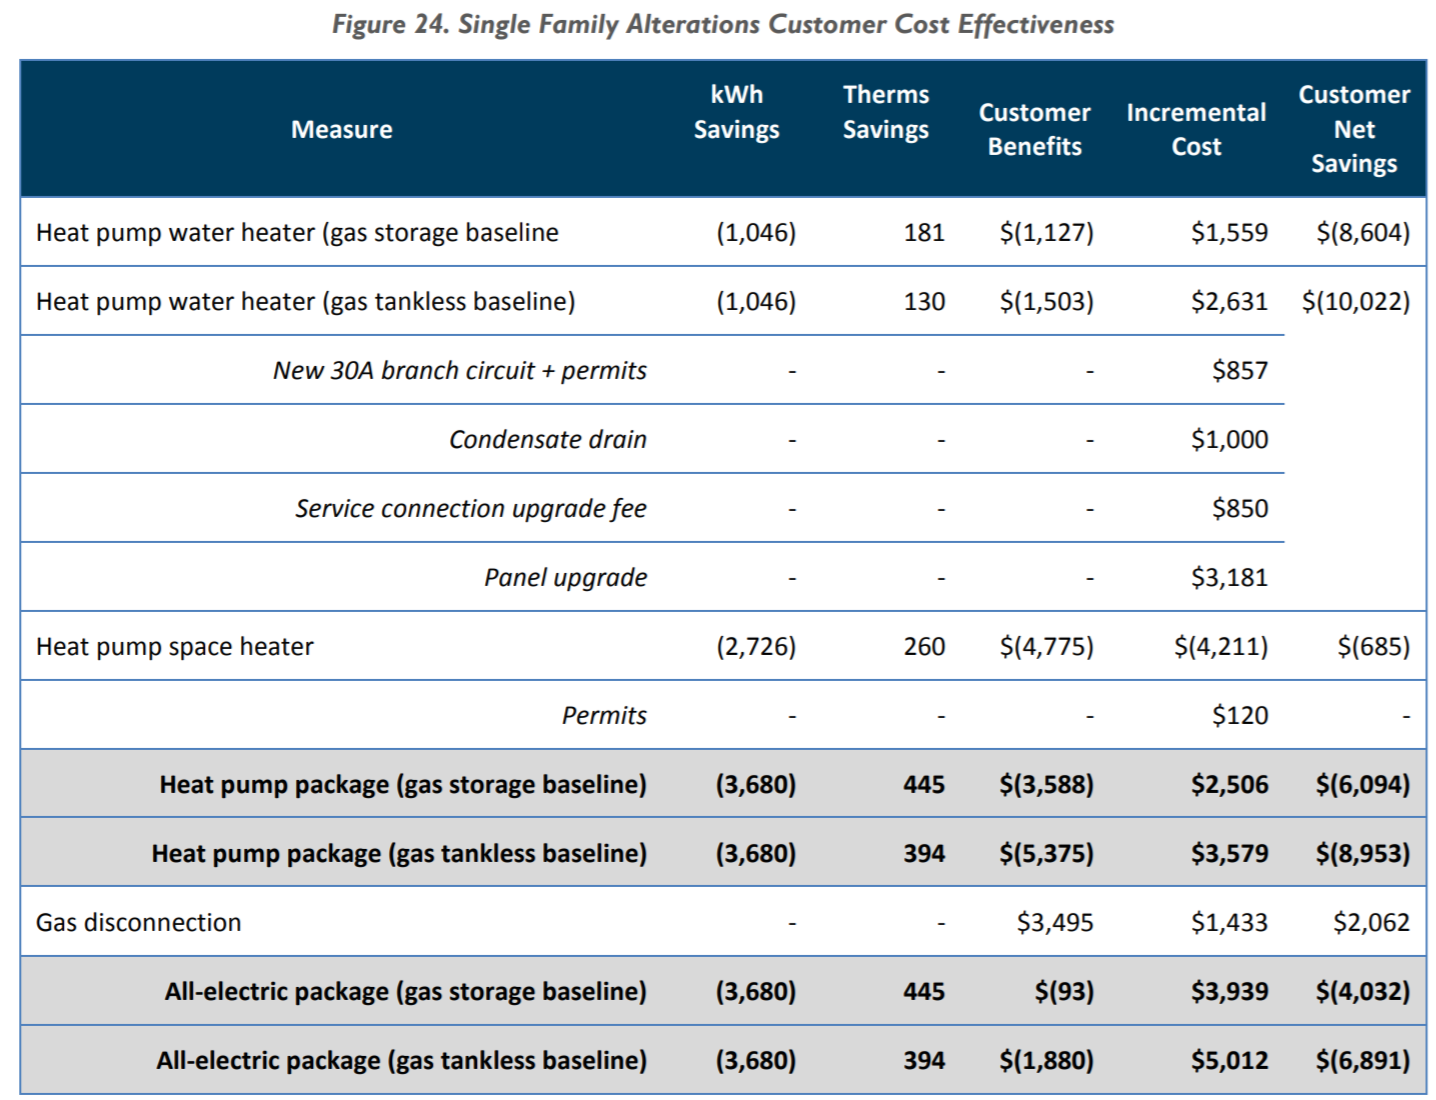
Figure 4.7: Figure from the City of Palo Alto’s 2016 Electrification study. Single family retrofit.
\(~\)
In the row labeled “Heat pump package (gas storage baseline)”, which describes a replacement of both an air and space gas heater with electric heat pumps, the modeled impact on annual energy consumption is an increase of electricity use by 3,680 kWh (because gas appliances have been replaced with electric appliances) and a decrease of gas use by 445 therms. This comes at a net cost to customers of $6,094.
Converting kWh and therms to kBTU and tCO2e yields the following:
Single Family Residential Retrofit
| Description | Amount |
|---|---|
| kBTU in one kWh | 3.4 |
| kBTU in one therm | 100 |
| kBTU electricity added per customer | 12,600 |
| kBTU gas saved per customer | 44,500 |
| lb CO2 in one electricity kWh (in 2020) | 0.1875 |
| lb CO2 in one gas therm | 11.7 |
| tCO2e electricity added per customer | 0.4 |
| tCO2e gas saved per customer | 2.4 |
| net tCO2e saved per customer | 2.0 |
The study also produced the same kinds of estimates for electrification in low-rise multifamily (7,000 sqft, two-story, 8 units) and small office (5,500 sqft, two-story) buildings (medium office building retrofits were considered to be significantly cost-prohibitive).
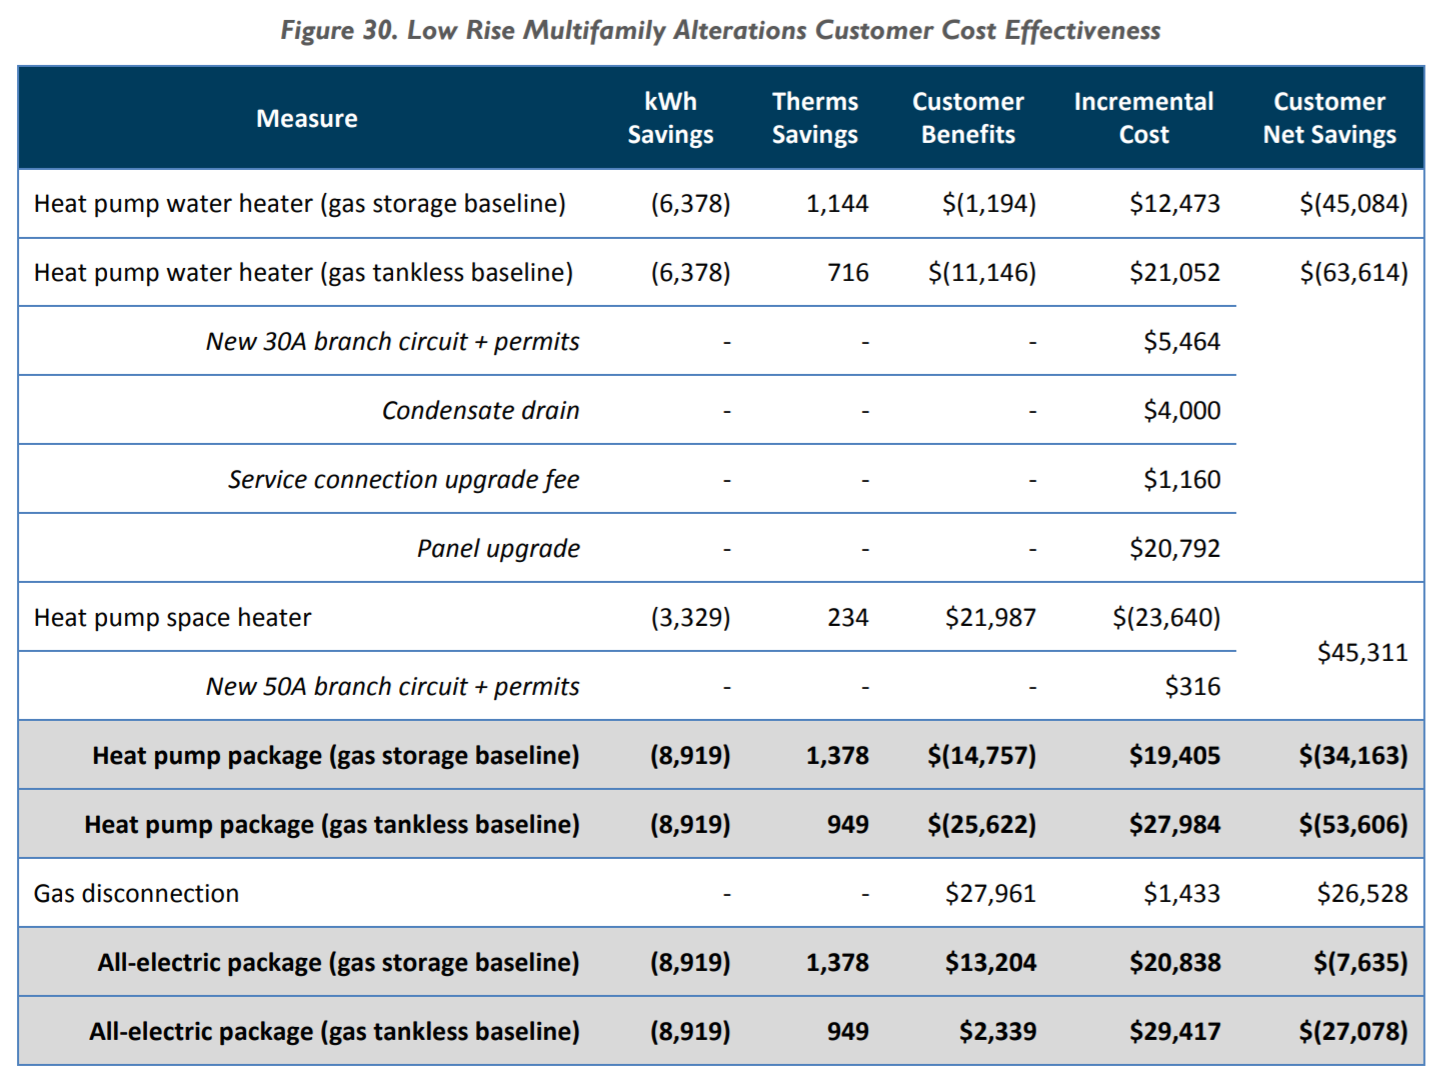
Figure 4.8: Figure from the City of Palo Alto’s 2016 Electrification study. Low-rise multifamily retrofit.
\(~\)
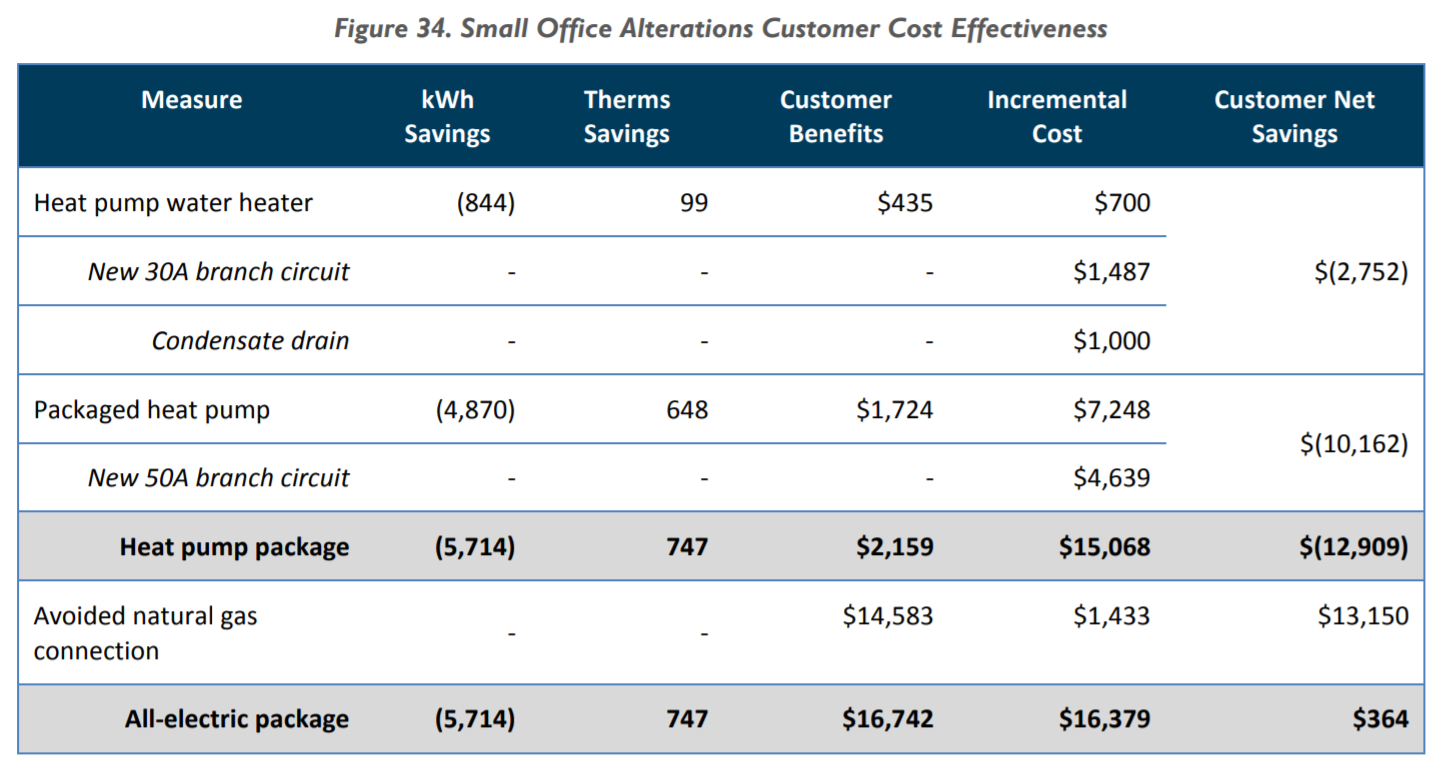
Figure 4.9: Figure from the City of Palo Alto’s 2016 Electrification study. Small office retrofit.
\(~\)
The table below summarizes the estimated net savings tCO2e per customer, using the same methodology as above, as well as the approximate number of buildings of each type in Stockton and their average building size.
bldg_electrification_summary <-
  bldg_join %>%
  st_set_geometry(NULL) %>%
  dplyr::select(bldg_tot, ZONE) %>%
  mutate(
    bldg_type =
      case_when(
        ZONE %in% c("RL","R-L","RLP","(RL)") ~ "Single family",
        ZONE %in% c("RM","(RM)","R-M","RMP","RH","RHP","(RH)") ~ "Low-rise multifamily",
        ZONE %in% c("CO","C-O") & bldg_tot < 17500 ~ "Small office",
        TRUE ~ "Other"
      ),
    bldg_type = bldg_type %>% factor(levels = c("Single family","Low-rise multifamily","Small office","Other"))
  ) %>%
  filter(bldg_type != "Other") %>%
  group_by(bldg_type) %>%
  summarize(
    Count = n(),
    Average_size = mean(bldg_tot, na.rm = T)
  ) %>%
  mutate(
    savings =
      case_when(
        bldg_type == "Single family" ~ (445*11.7 - 3680*0.1875)*0.000453592,
        bldg_type == "Low-rise multifamily" ~ (1378*11.7 - 8919*0.1875)*0.000453592,
        bldg_type == "Small office" ~ (747*11.7 - 5714*0.1875)*0.000453592
      )
  )

bldg_electrification_summary_table <-
  bldg_electrification_summary %>%
  transmute(
    `Building Type` = bldg_type,
    Count = prettyNum(round(Count/10^(nchar(Count)-2))*10^(nchar(Count)-2),big.mark=","),
    `Average Sqft` = prettyNum(round(Average_size,-2),big.mark=","),
    `tCO2e Savings` = round(savings,1)
  )

kable(
  bldg_electrification_summary_table,
  booktabs = TRUE,
  caption = 'Summary of electrification impacts for different building types in Stockton.'
) %>%
  kable_styling() %>%
scroll_box(width = "100%")| Building Type | Count | Average Sqft | tCO2e Savings |
|---|---|---|---|
| Single family | 79,000 | 3,300 | 2.0 |
| Low-rise multifamily | 12,000 | 4,500 | 6.6 |
| Small office | 860 | 5,700 | 3.5 |
\(~\)
Note the following caveats:
- Stockton’s climate zone (CZ12) experiences cooler winters and a greater number of heating degree days than Palo Alto, so the estimated savings for electrification should be even greater than estimated in Palo Alto.
- In the estimates above, electricity use is converted to tCO2e using 2020 emissions factors from PG&E. In 2040, if we assume that PG&E has reduced its electricity emissions factor to 0, then the savings for single family, multifamily, and small office buildings increase to 2.4, 7.3, and 4.0, respectively.
- Stockton’s single family housing stock is larger on average than Palo Alto’s, so savings should also be greater than estimated due to size.
The findings suggest that electrification of existing single family and multifamily residential buildings is a significant market and GHG reduction strategy.
In Section 2.10, we modeled the business-as-usual trends in energy efficiency and estimated that residential gas use per capita would naturally drop by 50% from 2020 to 2040 (while electricity use would naturally drop by 30%), based on the trends from 2013 to 2018. It is possible that some of this business-as-usual reduction is due to the natural replacement of old air and space gas heaters with more energy-efficient gas appliances or with electric appliances. But a proactive electrification campaign can be targeted towards those least likely to pursue electrification, either because of income or tensureship (renter as opposed to owner), and the estimated 2.0 tCO2/customer savings by 2040 either represents an entirely new set of households that wouldn’t have otherwise electrified, or a set of households that was encouraged to electrify a few years earlier than they would have.
Note that the City of Palo Alto study estimated that the electrification work would not lead to a net savings for customers, and instead cost them $6,000 (single family) to $34,000 (multifamily building owner) over the lifetime of the system. This likely represents the major barrier to electrification for residential customers. The City of Stockton could provide rebates to customers to reduce the cost of electrification in Stockton (which may be similar to Palo Alto’s estimate but deserves its own professional analysis outside the scope of this report), as well as educate residents about the health and environmental benefits of electrification.
The total environmental impact, as well as the impact on local jobs and public funding, depends on the number of retrofits that can be completed. As a ballpark estimate, Section 2.10 estimates the business-as-usual savings in annual residential tCO2e from 2020 to 2040 as 108,000. If these were entirely attributable to electrification retrofits (though in reality, energy efficiency improves would also include improvements many other factors), this would be equivalent to 36,000 single family homes (1,800 per year, 46% of total) and 5,500 multifamily buildings (275 per year), and the remaining gas footprint in 2040 would be equivalent to an additional 44,000 single family homes and 6,700 multifamily buildings yet to electrify.
According to the U.S. Department of Energy’s Better Buildings Neighborhood Program, a typical HVAC contractor employs around 10-15 employees and should target an average of 500 service contracts to be a sustainable business. So, the estimated range of high-wage jobs that could be sustained through electrification projects alone range from 50 to 100. The City of Stockton could support these workers by subsidizing training (or partnering with product manufacturers who have an incentive to provide free training so as to promote their products), helping to connect HVAC contractors to prospective customers, and providing additional business licensing and tax incentives.
As previously noted in Section 2.4, only 24% of Stockton high-wage construction workers work in Stockton. And Section 2.7 further notes that Stockton’s high-wage construction workers have an average commute footprint of 10.1 tCO2e. If the City of Stockton can specifically grow a local electrification workforce by bringing existing high-wage construction workers back to a new market within Stockton, then not only does the strategy lead to GHG reduction in electrified buildings, but also GHG reduction in commuting of approximately 500-1000 tCO2e/year. This second-order effect of localizing jobs is covered more systematically as a Local Jobs strategy.