2.2 Green Jobs
While there are many possible ways to identify “green jobs”, this report uses the Bureau of Labor Statistics Green Jobs Initiative classification of 333 NAICS industries which it has determined to potentially contain jobs that meet its definition of green jobs:
- Jobs in businesses that produce goods or provide services that benefit the environment or conserve natural resources.
- Jobs in which workers’ duties involve making their establishment’s production processes more environmentally friendly or use fewer natural resources.
Specifically, those 333 potential industries were classified into the following sub-categories:
- 58 in “Energy from renewable sources”
- 140 in “Energy efficiency”
- 124 in “Pollution reduction and removal, greenhouse gas reduction, and recycling and reuse”
- 75 in “Natural resource conservation”
- 45 in “Environmental compliance, education and training, and public awareness”
The following six tables filter the full Quarterly Workforce Indicators dataset to just the BLS-classified sectors, as well as further filtering in these five sub-categories. The top green job sectors span agriculture, building trades, and scientific research. This analysis is at the County level because the QWI data is only available at that scale. Overall, 15% of the jobs in SJC would be classified as “green jobs” using the BLS criteria.
green_jobs_classification <-
  read_csv("C:/Users/derek/Google Drive/City Systems/Stockton Green Economy/green_jobs_classification.csv")

green_jobs_summary <-
  green_jobs_classification %>%
  mutate(naics4digit = substr(`NAICS 2007`,1,4)) %>%
  group_by(naics4digit) %>%
  summarize(
    total = n(),
    green = sum(`BLS GGS in scope` =="Y"),
    green1 = sum(!is.na(`1. Energy from renewable sources`)),
    green2 = sum(!is.na(`2. Energy Efficiency`)),
    green3 = sum(!is.na(`3. Pollution reduction and removal, greenhouse gas reduction, and recycling and reuse`)),
    green4 = sum(!is.na(`4. Natural resource conservation`)),
    green5 = sum(!is.na(`5. Environmental compliance, education and training, and public awareness`))
  )

green_jobs_summary <-
  green_jobs_summary %>%
  mutate_at(vars("green","green1","green2","green3","green4","green5"), function(x){x/green_jobs_summary$total}) %>%
  filter(green > 0.5)

green_jobs_sjc_18 <-
  qwi_sjc %>%
  filter(year == 2018, industry %in% green_jobs_summary$naics4digit) %>%
  arrange(desc(EmpS)) %>%
  transmute(
    `Green job category` = label,
    Jobs = prettyNum(round(EmpS,-2),big.mark=","),
    `Average Earnings` = paste0("$",prettyNum(round(EarnS,-2),big.mark=","))
  )

kable(
  green_jobs_sjc_18,
  booktabs = TRUE,
  caption = 'Job counts and earnings by NAICS industry sector classified by BLS to contain green jobs and services for San Joaquin County 2018.'
  ) %>%
  kable_styling() %>%
scroll_box(width = "100%", height = "500px")| Green job category | Jobs | Average Earnings |
|---|---|---|
| Support Activities for Crop Production | 4,000 | $2,800 |
| Fruit and Tree Nut Farming | 2,900 | $3,000 |
| Building Equipment Contractors | 2,500 | $5,500 |
| Colleges, Universities, and Professional Schools | 2,300 | $4,500 |
| Building Finishing Contractors | 1,900 | $3,600 |
| Foundation, Structure, and Building Exterior Contractors | 1,800 | $4,100 |
| Residential Building Construction | 1,200 | $4,100 |
| Other Specialty Trade Contractors | 1,100 | $5,100 |
| Administration of Economic Programs | 1,100 | $6,700 |
| Cattle Ranching and Farming | 1,100 | $3,100 |
| Other Wood Product Manufacturing | 1,000 | $4,300 |
| Vegetable and Melon Farming | 900 | $3,600 |
| Nonresidential Building Construction | 800 | $5,100 |
| Greenhouse, Nursery, and Floriculture Production | 800 | $3,000 |
| Cement and Concrete Product Manufacturing | 800 | $5,200 |
| Architectural, Engineering, and Related Services | 600 | $6,800 |
| Water, Sewage and Other Systems | 600 | $6,800 |
| Glass and Glass Product Manufacturing | 600 | $6,800 |
| Commercial and Industrial Machinery and Equipment (except Automotive and Electronic) Repair and Maintenance | 500 | $4,700 |
| School and Employee Bus Transportation | 400 | $4,300 |
| Utility System Construction | 300 | $7,600 |
| Waste Collection | 300 | $5,700 |
| Newspaper, Periodical, Book, and Directory Publishers | 300 | $4,600 |
| Administration of Environmental Quality Programs | 300 | $5,900 |
| Business, Professional, Labor, Political, and Similar Organizations | 300 | $3,700 |
| Other Crop Farming | 300 | $3,200 |
| Oilseed and Grain Farming | 200 | $3,100 |
| Used Merchandise Stores | 200 | $2,000 |
| Veneer, Plywood, and Engineered Wood Product Manufacturing | 200 | $3,900 |
| Cable and Other Subscription Programming | 200 | $8,300 |
| Urban Transit Systems | 200 | $5,100 |
| Waste Treatment and Disposal | 200 | $6,100 |
| Navigational, Measuring, Electromedical, and Control Instruments Manufacturing | 200 | $4,500 |
| Other Information Services | 200 | $7,600 |
| Foundries | 200 | $4,000 |
| Other Heavy and Civil Engineering Construction | 200 | $6,200 |
| Museums, Historical Sites, and Similar Institutions | 100 | $4,000 |
| Poultry and Egg Production | 100 | $2,600 |
| Land Subdivision | 100 | $6,400 |
| Ventilation, Heating, Air-Conditioning, and Commercial Refrigeration Equipment Manufacturing | 100 | $5,200 |
| Remediation and Other Waste Management Services | 100 | $3,600 |
| Radio and Television Broadcasting | 100 | $5,300 |
| Electronic and Precision Equipment Repair and Maintenance | 100 | $3,900 |
| Specialized Design Services | 100 | $4,100 |
| Paint, Coating, and Adhesive Manufacturing | 100 | $4,500 |
| Support Activities for Animal Production | 0 | $2,900 |
| Other Chemical Product and Preparation Manufacturing | 0 | $2,700 |
| Motor Vehicle Parts Manufacturing | 0 | $6,400 |
| Commercial and Service Industry Machinery Manufacturing | 0 | $5,600 |
| Grantmaking and Giving Services | 0 | $4,000 |
| Other Animal Production | 0 | $2,500 |
| Scientific Research and Development Services | 0 | $5,400 |
| Computer and Peripheral Equipment Manufacturing | 0 | $3,800 |
| Software Publishers | 0 | $8,800 |
\(~\)
green1_jobs_sjc_18 <-
  qwi_sjc %>%
  filter(year == 2018, industry %in% green_jobs_summary[which(green_jobs_summary$green1>0.5),]$naics4digit) %>%
  arrange(desc(EmpS)) %>%
  transmute(
    `Green jobs related to Energy from renewable sources` = label,
    Jobs = prettyNum(round(EmpS,-2),big.mark=","),
    `Average Earnings` = paste0("$",prettyNum(round(EarnS,-2),big.mark=","))
  )

kable(
  green1_jobs_sjc_18,
  booktabs = TRUE,
  caption = 'Job counts and earnings by NAICS industry sector classified by BLS to contain green jobs and services related to "Energy from renewable sources" for San Joaquin County 2018.'
  ) %>%
  kable_styling() %>%
scroll_box(width = "100%")| Green jobs related to Energy from renewable sources | Jobs | Average Earnings |
|---|---|---|
| Fruit and Tree Nut Farming | 2,900 | $3,000 |
| Vegetable and Melon Farming | 900 | $3,600 |
| Oilseed and Grain Farming | 200 | $3,100 |
| Foundries | 200 | $4,000 |
| Other Heavy and Civil Engineering Construction | 200 | $6,200 |
| Land Subdivision | 100 | $6,400 |
| Scientific Research and Development Services | 0 | $5,400 |
\(~\)
green2_jobs_sjc_18 <-
  qwi_sjc %>%
  filter(year == 2018, industry %in% green_jobs_summary[which(green_jobs_summary$green2>0.5),]$naics4digit) %>%
  arrange(desc(EmpS)) %>%
  transmute(
    `Green jobs related to Energy Efficiency` = label,
    Jobs = prettyNum(EmpS,big.mark=","),
    `Average Earnings` = paste0("$",prettyNum(EarnS,big.mark=","))
  )

kable(
  green2_jobs_sjc_18,
  booktabs = TRUE,
  caption = 'Job counts and earnings by NAICS industry sector classified by BLS to contain green jobs and services related to "Energy efficiency" for San Joaquin County 2018.'
  ) %>%
  kable_styling() %>%
scroll_box(width = "100%")| Green jobs related to Energy Efficiency | Jobs | Average Earnings |
|---|---|---|
| Building Equipment Contractors | 2,545 | $5,545 |
| Foundation, Structure, and Building Exterior Contractors | 1,794 | $4,103 |
| Residential Building Construction | 1,178 | $4,123 |
| Nonresidential Building Construction | 814 | $5,068 |
| Cement and Concrete Product Manufacturing | 750 | $5,197 |
| Commercial and Industrial Machinery and Equipment (except Automotive and Electronic) Repair and Maintenance | 458 | $4,727 |
| School and Employee Bus Transportation | 386 | $4,281 |
| Urban Transit Systems | 219 | $5,064 |
| Other Heavy and Civil Engineering Construction | 151 | $6,197 |
| Land Subdivision | 119 | $6,431 |
| Ventilation, Heating, Air-Conditioning, and Commercial Refrigeration Equipment Manufacturing | 112 | $5,188 |
| Electronic and Precision Equipment Repair and Maintenance | 80 | $3,943 |
| Motor Vehicle Parts Manufacturing | 39 | $6,394 |
| Computer and Peripheral Equipment Manufacturing | 12 | $3,801 |
| Software Publishers | 10 | $8,825 |
\(~\)
green3_jobs_sjc_18 <-
  qwi_sjc %>%
  filter(year == 2018, industry %in% green_jobs_summary[which(green_jobs_summary$green3>0.5),]$naics4digit) %>%
  arrange(desc(EmpS)) %>%
  transmute(
    `Green jobs related to Pollution reduction and removal, greenhouse gas reduction, and recycling and reuse` = label,
    Jobs = prettyNum(round(EmpS,-2),big.mark=","),
    `Average Earnings` = paste0("$",prettyNum(round(EarnS,-2),big.mark=","))
  )

kable(
  green3_jobs_sjc_18,
  booktabs = TRUE,
  caption = 'Job counts and earnings by NAICS industry sector classified by BLS to contain green jobs and services related to "Pollution reduction and removal, greenhouse gas reduction, and recycling and reuse" for San Joaquin County 2018.'
  ) %>%
  kable_styling() %>%
scroll_box(width = "100%")| Green jobs related to Pollution reduction and removal, greenhouse gas reduction, and recycling and reuse | Jobs | Average Earnings |
|---|---|---|
| Building Finishing Contractors | 1,900 | $3,600 |
| Residential Building Construction | 1,200 | $4,100 |
| Other Specialty Trade Contractors | 1,100 | $5,100 |
| Other Wood Product Manufacturing | 1,000 | $4,300 |
| Nonresidential Building Construction | 800 | $5,100 |
| Water, Sewage and Other Systems | 600 | $6,800 |
| Glass and Glass Product Manufacturing | 600 | $6,800 |
| Utility System Construction | 300 | $7,600 |
| Waste Collection | 300 | $5,700 |
| Used Merchandise Stores | 200 | $2,000 |
| Veneer, Plywood, and Engineered Wood Product Manufacturing | 200 | $3,900 |
| Waste Treatment and Disposal | 200 | $6,100 |
| Other Heavy and Civil Engineering Construction | 200 | $6,200 |
| Remediation and Other Waste Management Services | 100 | $3,600 |
| Paint, Coating, and Adhesive Manufacturing | 100 | $4,500 |
| Other Chemical Product and Preparation Manufacturing | 0 | $2,700 |
| Motor Vehicle Parts Manufacturing | 0 | $6,400 |
| Scientific Research and Development Services | 0 | $5,400 |
| Software Publishers | 0 | $8,800 |
\(~\)
green4_jobs_sjc_18 <-
  qwi_sjc %>%
  filter(year == 2018, industry %in% green_jobs_summary[which(green_jobs_summary$green4>0.5),]$naics4digit) %>%
  arrange(desc(EmpS)) %>%
  transmute(
    `Green jobs related to Natural resource conservation` = label,
    Jobs = prettyNum(round(EmpS,-2),big.mark=","),
    `Average Earnings` = paste0("$",prettyNum(round(EarnS,-2),big.mark=","))
  )

kable(
  green4_jobs_sjc_18,
  booktabs = TRUE,
  caption = 'Job counts and earnings by NAICS industry sector classified by BLS to contain green jobs and services related to "Natural resource conservation" for San Joaquin County 2018.'
  ) %>%
  kable_styling() %>%
scroll_box(width = "100%")| Green jobs related to Natural resource conservation | Jobs | Average Earnings |
|---|---|---|
| Support Activities for Crop Production | 4,000 | $2,800 |
| Fruit and Tree Nut Farming | 2,900 | $3,000 |
| Other Specialty Trade Contractors | 1,100 | $5,100 |
| Cattle Ranching and Farming | 1,100 | $3,100 |
| Vegetable and Melon Farming | 900 | $3,600 |
| Greenhouse, Nursery, and Floriculture Production | 800 | $3,000 |
| Other Crop Farming | 300 | $3,200 |
| Oilseed and Grain Farming | 200 | $3,100 |
| Poultry and Egg Production | 100 | $2,600 |
| Land Subdivision | 100 | $6,400 |
| Support Activities for Animal Production | 0 | $2,900 |
| Other Animal Production | 0 | $2,500 |
\(~\)
green5_jobs_sjc_18 <-
  qwi_sjc %>%
  filter(year == 2018, industry %in% green_jobs_summary[which(green_jobs_summary$green5>0.5),]$naics4digit) %>%
  arrange(desc(EmpS)) %>%
  transmute(
    `Green jobs related to Environmental compliance, education and training, and public awareness` = label,
    Jobs = prettyNum(round(EmpS,-2),big.mark=","),
    `Average Earnings` = paste0("$",prettyNum(round(EarnS,-2),big.mark=","))
  )

kable(
  green5_jobs_sjc_18,
  booktabs = TRUE,
  caption = 'Job counts and earnings by NAICS industry sector classified by BLS to contain green jobs and services related to "Environmental compliance, education and training, and public awareness" for San Joaquin County 2017.'
  ) %>%
  kable_styling() %>%
scroll_box(width = "100%")| Green jobs related to Environmental compliance, education and training, and public awareness | Jobs | Average Earnings |
|---|---|---|
| Colleges, Universities, and Professional Schools | 2,300 | $4,500 |
| Administration of Economic Programs | 1,100 | $6,700 |
| Newspaper, Periodical, Book, and Directory Publishers | 300 | $4,600 |
| Administration of Environmental Quality Programs | 300 | $5,900 |
| Business, Professional, Labor, Political, and Similar Organizations | 300 | $3,700 |
| Cable and Other Subscription Programming | 200 | $8,300 |
| Other Information Services | 200 | $7,600 |
| Museums, Historical Sites, and Similar Institutions | 100 | $4,000 |
| Radio and Television Broadcasting | 100 | $5,300 |
| Grantmaking and Giving Services | 0 | $4,000 |
| Software Publishers | 0 | $8,800 |
\(~\)
The following table compares green jobs statistics for all counties in California, sorted by total number of green jobs. “Green Job Wage Premium” is the ratio of average green jobs earnings to average all jobs earnings. Of 58 counties, SJC ranks 19th in the state in terms of total number of green jobs, but 42nd in terms of percent green jobs and 38th in terms of green job wage premium.
# qwi_ca <- NULL
#
# for(years in 2010:2018){
#   for(county in ca_counties$COUNTYFP){
#     qwi<-
#       getCensus(
#         name = "timeseries/qwi/sa",
#         region = paste0("county:",county),
#         regionin = "state:06",
#         vars = c("EmpS","EarnS","industry","ind_level"),
#         time = years
#       ) %>%
#       filter(ind_level == 4) %>%
#       mutate(
#         year = substr(time,1,4)
#       ) %>%
#       left_join(label_industry, by= "industry") %>%
#       group_by(year,county,industry,label) %>%
#       summarize(
#         EmpS = round(mean(as.numeric(EmpS), na.rm = TRUE),0),
#         EarnS = round(mean(as.numeric(EarnS), na.rm = TRUE),0)
#       ) %>%
#       filter(!is.na(EmpS) & EmpS != 0)
#
#     qwi_ca<-
#       rbind(qwi_ca,qwi)
#   }
# }
#
# save(qwi_ca, file = "C:/Users/derek/Google Drive/City Systems/Stockton Green Economy/qwi_ca.Rdata")
load("C:/Users/derek/Google Drive/City Systems/Stockton Green Economy/qwi_ca.Rdata")

jobs_ca_compare <-
  qwi_ca %>%
  group_by(year,county) %>%
  summarize(
    totaljobs = sum(EmpS, na.rm=T),
    totaljobsearnings = weighted.mean(EarnS,EmpS, na.rm=T)
  )

green_jobs_ca_compare <-
  qwi_ca %>%
  filter(industry %in% green_jobs_summary$naics4digit) %>%
  group_by(year,county) %>%
  summarize(
    totalgreenjobs = sum(EmpS, na.rm=T),
    totalgreenjobsearnings = weighted.mean(EarnS,EmpS, na.rm=T)
  ) %>%
  left_join(jobs_ca_compare, by = c("year","county")) %>%
  mutate(
    perc_green_jobs = totalgreenjobs/totaljobs,
    wage_premium = totalgreenjobsearnings/totaljobsearnings
  ) %>%
  left_join(ca_counties %>% dplyr::select(COUNTYFP,NAME) %>%  st_set_geometry(NULL), by = c("county"="COUNTYFP"))

green_jobs_ca_compare_table <-
  green_jobs_ca_compare %>%
  ungroup() %>%
  filter(year == 2018) %>%
  arrange(desc(totalgreenjobs %>% as.numeric())) %>%
  transmute(
    County = NAME,
    `Green Jobs (#)` = prettyNum(round(totalgreenjobs/10^(nchar(totalgreenjobs)-2))*10^(nchar(totalgreenjobs)-2),big.mark=","),
    `Green Jobs (%)` = round(perc_green_jobs*100),
    `Green Jobs Average Quarterly Earnings` = paste0("$",prettyNum(round(totalgreenjobsearnings),big.mark=",")),
    `Green Job Wage Premium (%)` = round((wage_premium-1)*100)
  )

kable(
  green_jobs_ca_compare_table,
  booktabs = TRUE,
  caption = 'Comparison of green jobs by County. Source: QWI 2018.'
) %>%
  kable_styling() %>%
scroll_box(width = "100%", height = "500px")| County | Green Jobs (#) | Green Jobs (%) | Green Jobs Average Quarterly Earnings | Green Job Wage Premium (%) |
|---|---|---|---|---|
| Los Angeles | 490,000 | 12 | $6,922 | 36 |
| Santa Clara | 270,000 | 27 | $18,454 | 62 |
| San Diego | 250,000 | 20 | $7,501 | 42 |
| Orange | 230,000 | 15 | $7,105 | 30 |
| Alameda | 160,000 | 22 | $8,588 | 31 |
| San Francisco | 120,000 | 19 | $10,981 | 13 |
| Riverside | 110,000 | 17 | $4,526 | 14 |
| Sacramento | 100,000 | 18 | $6,261 | 25 |
| San Mateo | 85,000 | 23 | $22,435 | 103 |
| San Bernardino | 74,000 | 11 | $4,989 | 22 |
| Fresno | 67,000 | 21 | $3,923 | 3 |
| Kern | 61,000 | 25 | $3,649 | -12 |
| Ventura | 52,000 | 19 | $4,520 | -6 |
| Monterey | 52,000 | 35 | $3,849 | -7 |
| Contra Costa | 46,000 | 14 | $6,854 | 14 |
| Santa Barbara | 45,000 | 28 | $4,964 | 9 |
| Tulare | 34,000 | 26 | $2,994 | -13 |
| Sonoma | 32,000 | 18 | $5,361 | 16 |
| San Joaquin | 32,000 | 15 | $4,377 | 8 |
| Solano | 31,000 | 23 | $6,313 | 20 |
| Stanislaus | 26,000 | 16 | $4,183 | 1 |
| Placer | 22,000 | 15 | $5,296 | 9 |
| Santa Cruz | 19,000 | 22 | $5,489 | 23 |
| San Luis Obispo | 18,000 | 20 | $4,677 | 11 |
| Merced | 16,000 | 26 | $3,505 | -2 |
| Marin | 14,000 | 15 | $6,698 | 9 |
| Napa | 12,000 | 18 | $5,106 | 6 |
| Yolo | 12,000 | 17 | $5,166 | 19 |
| Butte | 11,000 | 17 | $4,203 | 13 |
| Madera | 9,600 | 26 | $3,043 | -23 |
| Imperial | 9,600 | 20 | $3,233 | -8 |
| El Dorado | 7,800 | 18 | $5,481 | 26 |
| Kings | 6,900 | 19 | $3,452 | -16 |
| Humboldt | 6,800 | 17 | $4,347 | 27 |
| Shasta | 6,200 | 12 | $4,677 | 28 |
| Nevada | 5,100 | 21 | $4,881 | 23 |
| Sutter | 4,600 | 20 | $3,215 | -11 |
| Tehama | 4,300 | 33 | $4,825 | 30 |
| San Benito | 3,900 | 34 | $4,046 | 3 |
| Mendocino | 3,600 | 14 | $3,955 | 15 |
| Yuba | 3,300 | 31 | $4,665 | 25 |
| Glenn | 2,400 | 38 | $3,679 | 3 |
| Colusa | 2,000 | 35 | $3,491 | -5 |
| Lake | 1,600 | 14 | $3,303 | 10 |
| Calaveras | 1,500 | 23 | $4,774 | 41 |
| Siskiyou | 1,300 | 15 | $3,961 | 19 |
| Tuolumne | 1,200 | 11 | $4,351 | 17 |
| Amador | 920 | 10 | $3,958 | 1 |
| Mono | 580 | 12 | $3,613 | 14 |
| Inyo | 580 | 12 | $5,254 | 39 |
| Plumas | 550 | 14 | $3,413 | 7 |
| Mariposa | 540 | 21 | $5,777 | 72 |
| Lassen | 520 | 11 | $4,267 | -12 |
| Del Norte | 420 | 8 | $2,897 | -32 |
| Modoc | 410 | 33 | $3,359 | 12 |
| Trinity | 89 | 8 | $2,719 | 5 |
| Alpine | 46 | 66 | $3,934 | 38 |
| Sierra | 36 | 16 | $3,524 | 17 |
\(~\)
The following is a plot of percent green jobs from 2010-2018 for SJC and its closest neighboring counties. SJC’s percent green jobs has stayed mostly stagnant and even dipped in the past couple of years, and is low compared to its neighboring counties.
green_jobs_ca_compare %>%
  filter(NAME %in% c("San Joaquin","Stanislaus","Alameda","Sacramento","Fresno","Solano","Contra Costa")) %>%
  ggplot(
    aes(
      x = year %>% as.numeric(),
      y = perc_green_jobs*100,
      colour = NAME
    )
  ) +
  geom_line() +
  labs(
    x = "Year",
    y = "% Green Jobs",
    colour = "County"
  )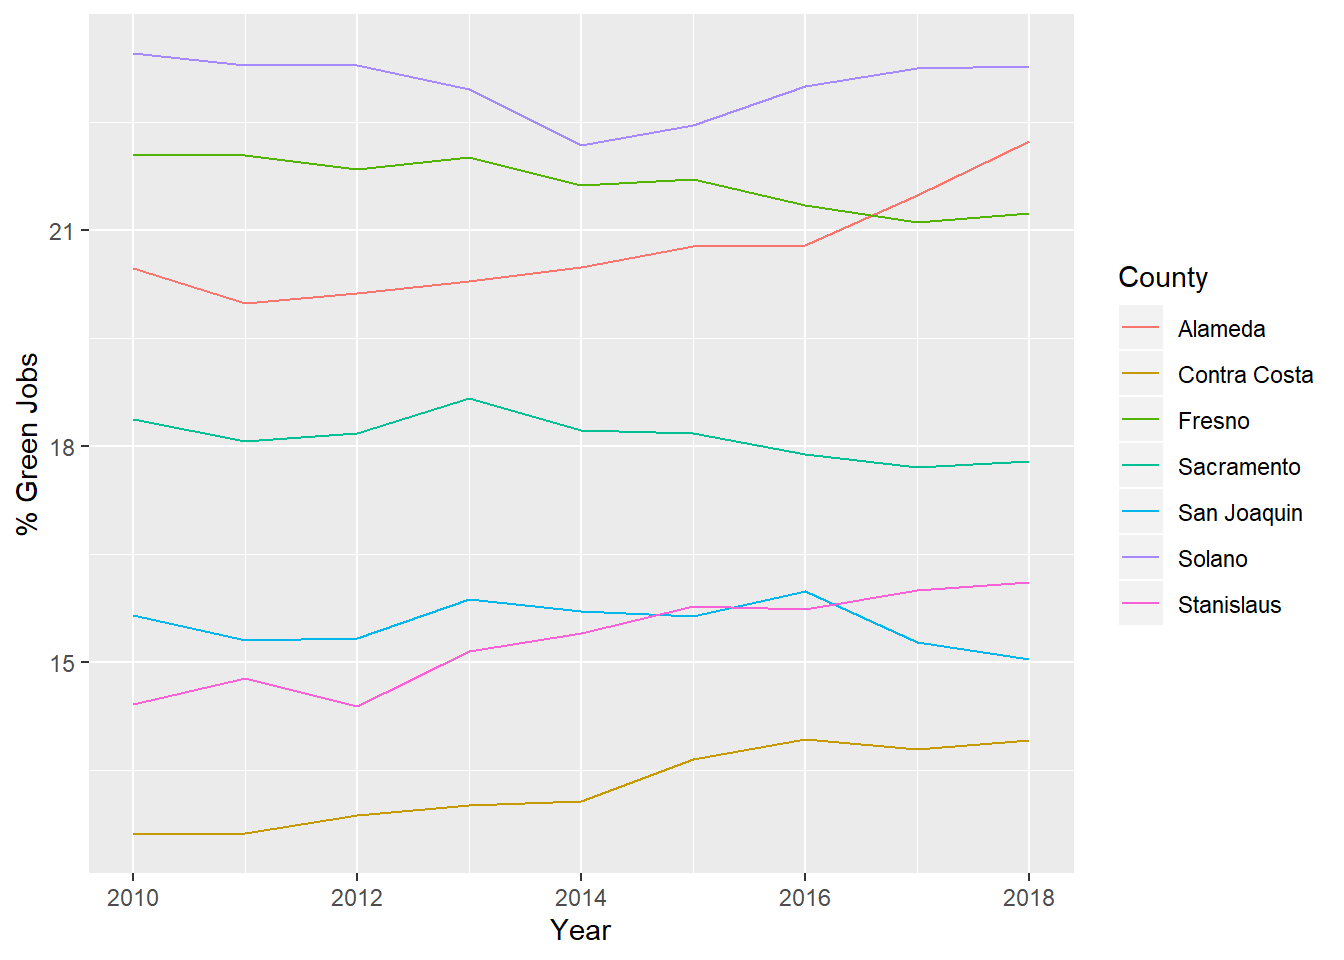
Figure 2.7: Percent green jobs by county, 2010-2018. Source: QWI
\(~\)
The following is a plot of green job wage premium from 2010-2018 for SJC and its closest neighboring counties. SJC’s green job wage premium is also low relative its neighboring counties, but is at least steadily increasing at a similar or better pace.
green_jobs_ca_compare %>%
  filter(NAME %in% c("San Joaquin","Stanislaus","Alameda","Sacramento","Fresno","Solano","Contra Costa")) %>%
  ggplot(
    aes(
      x = year %>% as.numeric(),
      y = (wage_premium-1)*100,
      colour = NAME
    )
  ) +
  geom_line() +
  labs(
    x = "Year",
    y = "% Green Job Wage Premium",
    colour = "County"
  )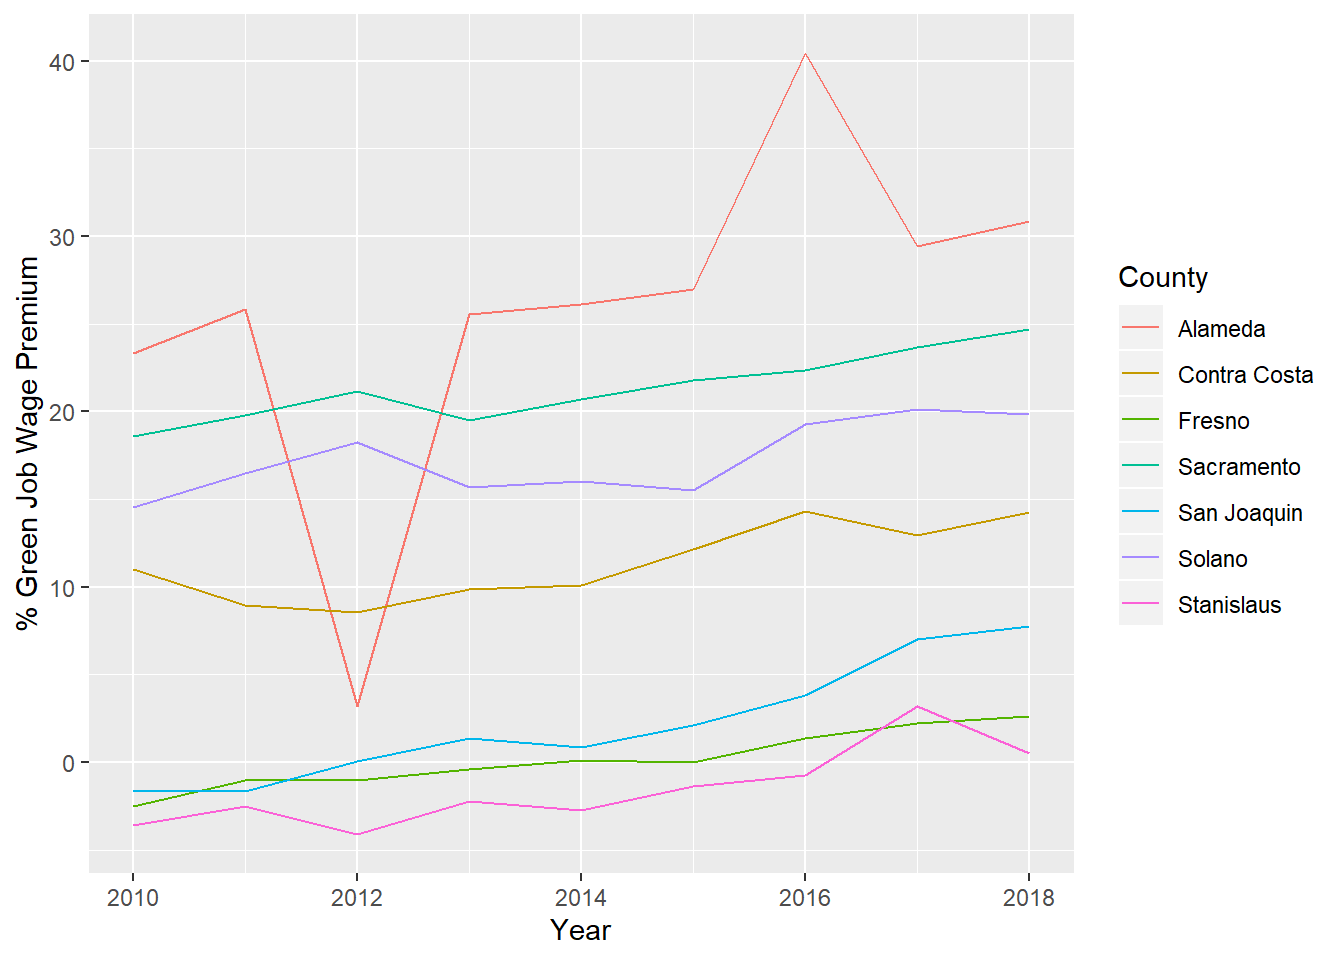
Figure 2.8: Green job wage premium by county, 2010-2018. Source: QWI