2.6 Non-Commute Vehicle Miles Traveled
While commute-related driving is the primary way cities currently evaluate their GHG transportation footprint, residents also do a significant amount of non-commute-related driving, which also has its own GHG footprint. We are developing a methodology to produce an order-of-magnitude estimation of VMTs associated with Stockton residents traveling to places of economic activity, such as grocery stores and restaurants.
The full analytical methodology is still being refined and deserves its own separate report to detail, but generally follows these steps:
We used 2018 Safegraph data to collect trip visit data to amenities in and around Stockton by Stockton residents. Safegraph reports total visits from its panel of monitored devices each month, which can be weighted to represent the full population. It indicates any census block group which is the origin of more than 5 monitored devices in a given month, which can be used to estimate the routes and VMTs for Stockton visitors, similar to how origin-destination data is used in the commute VMT analysis. We also applied revision factors to the analysis to account for: (1) converting Safegraph s reported median travel distance to mean; (2) linked trips, such as dropping by the grocery store and library on the same trip, which reduce the total VMTs; (3) carpooling; and other factors.
The map below shows the location of all points of interest in California that had recorded visitors from Stockton in 2018. Each point is colored and sized based on the VMTs we calculated associated with Stockton visitors; purple/small is low, yellow/large is high.
load("C:/Users/derek/Google Drive/City Systems/Stockton Green Economy/results.Rdata")

amenity_VMT <- location_VMT_new_join_agg
colnames(amenity_VMT)[2] <- "location name"
colnames(amenity_VMT)[3] <- "total VMT"
colnames(amenity_VMT)[4] <- "business type"
colnames(amenity_VMT)[7] <- "street address"
colnames(amenity_VMT)[10] <- "zip code"

amenity_VMT$full_address <- NULL
amenity_VMT$sub_category <- NULL
amenity_VMT$naics_code <- NULL

amenity_VMT <- amenity_VMT[,c("total VMT", "location name", "business type", "street address", "city", "state", "zip code", "geometry")]

# map <- mapview(amenity_VMT, zcol = "total VMT", legend = TRUE, cex= "total VMT", alpha = 0)
#
# mapshot(map, url = "map-amenity-vmt-location.html")

knitr::include_url("https://citysystems.github.io/stockton-greeneconomy/map-amenity-vmt-location.html")
Figure 2.26: Location of points of interest with Stockton visitors in 2018. Source: Safegraph.
\(~\)
The following plot shows the distribution of VMTs by amenity type (out of hundreds available). The largest category by far is the second tall bar, “Restaurants and Other Eating Places”, followed by “Traveler Accommodations” and “Gas Stations”.
business_listing <- unique(location_VMT_new_join_agg$top_category)
bus_list_df <- data.frame(matrix(data = 0, nrow = length(business_listing), ncol = 3))
colnames(bus_list_df) <- c("business type", "total VMT", "% VMT")

count <- 0

for (business_iter in business_listing){

  count <- count + 1
  bus_iter_df <- location_VMT_new_join_agg[location_VMT_new_join_agg$top_category == business_iter, ]

  bus_list_df[count, "business type"] <- business_iter
  bus_list_df[count, "total VMT"] <- sum(bus_iter_df$VMT_total, na.rm = TRUE)

}

bus_list_df[, "% VMT"] <- bus_list_df[, "total VMT"] / sum(bus_list_df[, "total VMT"]) * 100

bus_list_df_ordered <- bus_list_df[order(-bus_list_df$`total VMT`),]
colnames(bus_list_df_ordered) <- c("business_type", "total_VMT", "p_VMT")

bus_list_df_ordered_other_label <- "Other"
bus_list_df_ordered_other_VMT <- sum(as.numeric(bus_list_df_ordered[21:nrow(bus_list_df_ordered),'total_VMT']))
bus_list_df_ordered_other_perc <- sum(as.numeric(bus_list_df_ordered[21:nrow(bus_list_df_ordered),'p_VMT']))
bus_list_df_ordered_other <- cbind(bus_list_df_ordered_other_label, bus_list_df_ordered_other_VMT, bus_list_df_ordered_other_perc)
colnames(bus_list_df_ordered_other) <- c("business_type", "total_VMT", "p_VMT")

bus_list_df_ordered_new <- rbind(bus_list_df_ordered[1:20,], bus_list_df_ordered_other)
colnames(bus_list_df_ordered_new) <- c("business_type", "total_VMT", "p_VMT")
bus_list_df_ordered_new$total_VMT <- as.numeric(bus_list_df_ordered_new$total_VMT)

ggplot(
  bus_list_df_ordered_new,
  aes(
    x = business_type,
    y = total_VMT
  )
) +
  geom_bar(stat = 'identity', aes(fill = total_VMT), position = "dodge") +
  labs(x = "Amenity Type", y = "Total VMT", title = "Amenity Type VMT Count") +
  theme(axis.text.x = element_text(angle = 35, hjust = 1)) +
  theme(legend.position = "none")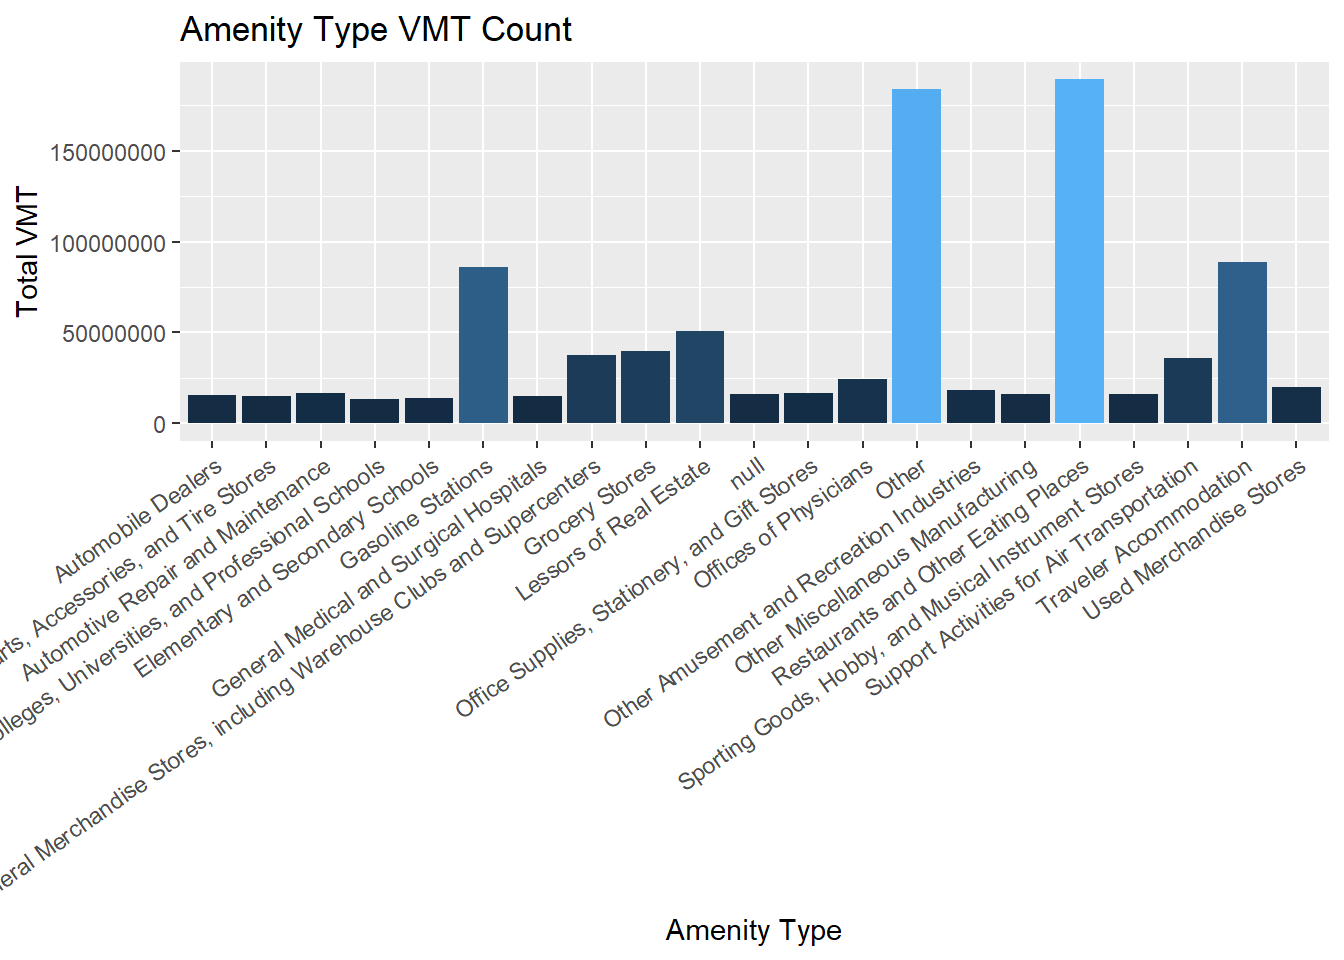
Figure 2.27: Non-commute VMT by type of amenity. Source: Safegraph 2018.
\(~\)
The following table shows the top 50 individual points of interest from the same dataset.
location_VMT_CA_table <-
  location_VMT_new_join_agg %>%
  transmute(
    'Location Name' = location_name,
    'Total Stockton VMT' = VMT_total %>% as.numeric(),
    'Amenity Type' = top_category,
    'Street Address' = street_address,
    'City' = city
  ) %>%
  arrange(desc(`Total Stockton VMT`))

location_VMT_CA_table$geometry <- NULL
location_VMT_CA_table$`Total Stockton VMT` <- prettyNum(round(location_VMT_CA_table$`Total Stockton VMT`,-4),big.mark=",")

kable(location_VMT_CA_table[1:50,], booktabs = TRUE, caption = "Top 50 points of interest for Stockton residents in 2018. Source: Safegraph.") %>% kable_styling() %>% scroll_box(width = "100%", height = "500px")| Location Name | Total Stockton VMT | Amenity Type | Street Address | City |
|---|---|---|---|---|
| Pilot Travel Centers | 26,730,000 | Gasoline Stations | 345 roth road | lathrop |
| Love’s Travel Stop | 23,200,000 | Gasoline Stations | 15250 thornton road | lodi |
| Red Chillies | 20,560,000 | Restaurants and Other Eating Places | 167 south main street | milpitas |
| Park West Place | 16,330,000 | Lessors of Real Estate | 10318 10940 trinity parkway | stockton |
| Pilot Travel Centers | 14,370,000 | NA | NA | NA |
| san francisco international airport | 14,260,000 | Support Activities for Air Transportation | sfo | san francisco |
| The Outlet Thrift Store | 12,700,000 | Used Merchandise Stores | 1212 east harding way | stockton |
| La Quinta Inns & Suites | 12,290,000 | Traveler Accommodation | 2710 west march lane | stockton |
| Hilton International | 11,190,000 | Traveler Accommodation | 2323 grand canal boulevard | stockton |
| metropolitan oakland intl airport | 10,690,000 | Support Activities for Air Transportation | metropolitan oakland intl airport | oakland |
| sacramento intl airport | 8,320,000 | Support Activities for Air Transportation | sacramento intl airport | sacramento |
| Weberstown Mall Vicinity | 7,350,000 | Lessors of Real Estate | 4950 pacific avenue | stockton |
| Amtrak | 6,980,000 | NA | NA | NA |
| Four Copies | 6,660,000 | Office Supplies, Stationery, and Gift Stores | 2538 west lane | stockton |
| Pilot Travel Centers | 6,520,000 | Gasoline Stations | 15100 north thornton road | lodi |
| san joaquin general hospital | 6,480,000 | General Medical and Surgical Hospitals | 500 west hospital road | french camp |
| Herbert S Miles Safety Roadside Rest | 6,410,000 | NA | NA | NA |
| Sherwood Mall Vicinity | 5,730,000 | Lessors of Real Estate | 5308 pacific avenue | stockton |
| Cinnabon | 5,610,000 | Restaurants and Other Eating Places | 15327 thornton road | lodi |
| San Francisco International Airport Terminal 3 E | 5,580,000 | Traveler Accommodation | 806 south airport boulevard | san francisco |
| Courtyard by Marriott | 5,490,000 | Traveler Accommodation | 3252 west march lane | stockton |
| SUBWAY | 5,230,000 | NA | NA | NA |
| Fairfield Inn & Suites by Marriott | 5,200,000 | Traveler Accommodation | 227 west san marcos boulevard | san marcos |
| Jackson Rancheria Casino Resort | 5,190,000 | Gambling Industries | 12222 new york ranch road | jackson |
| san joaquin delta college | 5,160,000 | Colleges, Universities, and Professional Schools | san joaquin delta college | stockton |
| Boron Rest Area | 5,130,000 | NA | NA | NA |
| Walmart | 5,010,000 | General Merchandise Stores, including Warehouse Clubs and Supercenters | 3223 east hammer lane | stockton |
| SUBWAY | 5,000,000 | Restaurants and Other Eating Places | 15237 thornton road | lodi |
| alex g spanos center | 4,960,000 | Promoters of Performing Arts, Sports, and Similar Events | 1040 dave brubeck way university of the pacific | stockton |
| The Center | 4,860,000 | Lessors of Real Estate | the center | stockton |
| Walmart | 4,690,000 | General Merchandise Stores, including Warehouse Clubs and Supercenters | 10355 trinity parkway | stockton |
| Candy Cane Inn | 4,680,000 | Traveler Accommodation | 1747 south harbor boulevard | anaheim |
| College Square | 4,670,000 | Lessors of Real Estate | 909 west march lane | stockton |
| Pilot Travel Centers | 4,580,000 | NA | NA | NA |
| Depot Deli | 4,520,000 | Beer, Wine, and Liquor Stores | 200 west florida avenue | hemet |
| Certified Grocers of California Salvage | 4,140,000 | General Merchandise Stores, including Warehouse Clubs and Supercenters | 1990 piccoli road | stockton |
| st josephs medical center of stockton | 4,140,000 | General Medical and Surgical Hospitals | 1800 north california street | stockton |
| University Plaza Waterfront Hotel | 4,030,000 | Traveler Accommodation | 110 west fremont street | stockton |
| 7D Experience | 3,890,000 | Amusement Parks and Arcades | pier 39 building m 1 | san francisco |
| Margaret’s Cafe & Bakery | 3,710,000 | Restaurants and Other Eating Places | 12222 new york ranch road | jackson |
| DeRosa University Center | 3,600,000 | Restaurants and Other Eating Places | 901 presidents drive | stockton |
| University of the Pacific | 3,580,000 | Colleges, Universities, and Professional Schools | 3601 pacific avenue | stockton |
| Holiday Inn Express | 3,550,000 | Traveler Accommodation | 5045 kingsley road | stockton |
| Eagle Cafe | 3,540,000 | NA | NA | NA |
| Best Western | 3,520,000 | Traveler Accommodation | 111 east march lane | stockton |
| Zuniga Ramiro MD San Joaquin General Hospital | 3,440,000 | Offices of Physicians | 500 west hospital road | french camp |
| Anello Family Crab & Seafood | 3,410,000 | NA | NA | NA |
| Coastal Pacific Food | 3,400,000 | Grocery Stores | 1015 performance drive | stockton |
| disney california adventure park | 3,330,000 | NA | NA | NA |
| Stockton Metropolitan Airport | 3,320,000 | Traveler Accommodation | 5000 south airport way | stockton |
\(~\)
The following map shows the same data aggregated back to Stockton blockgroups, and shown as VMT per capita. For most of Stockton there is no clear pattern, but some there are notable block groups at the periphery that have high VMT per capita. Transit and ride-sharing strategies, or land use policy and development that brings needed amenities closer to where people live, could target VMT reduction where it is needed the most.
# map <- mapview(bg_VMT, zcol = c("per_capita"), legend = TRUE, layer.name = "Non-commute<br>VMTper capita")
#
# mapshot(map, url = "map-amenity-vmt-bg.html")

knitr::include_url("https://citysystems.github.io/stockton-greeneconomy/map-amenity-vmt-bg.html")
Figure 2.28: Non-commute VMT per capita by block group. Source: Safegraph 2018.
\(~\)
Overall, the VMTs associated with non-commute travel in 2018 sum up to about 1.2 billion, compared to an estimated 2.2 billion for commute travel, a roughly 1:2 ratio. This preliminary work suggests that strategies to reduce non-commute travel, which may be much more actionable for local cities, may have impacts up to half the size of commuter-oriented strategies, and should not be ignored.