4.1 Methodology
Chapter 2’s baseline assessment has already set up the framework for how we will evaluate the effectiveness of any green economy strategies we might consider. Whatever the strategy may be, it would need to have a predicted positive effect on one of the variable inputs in our GHG model. The following diagram shows those variables highlighted in yellow, and their business-as-usual trends as up/down arrows.
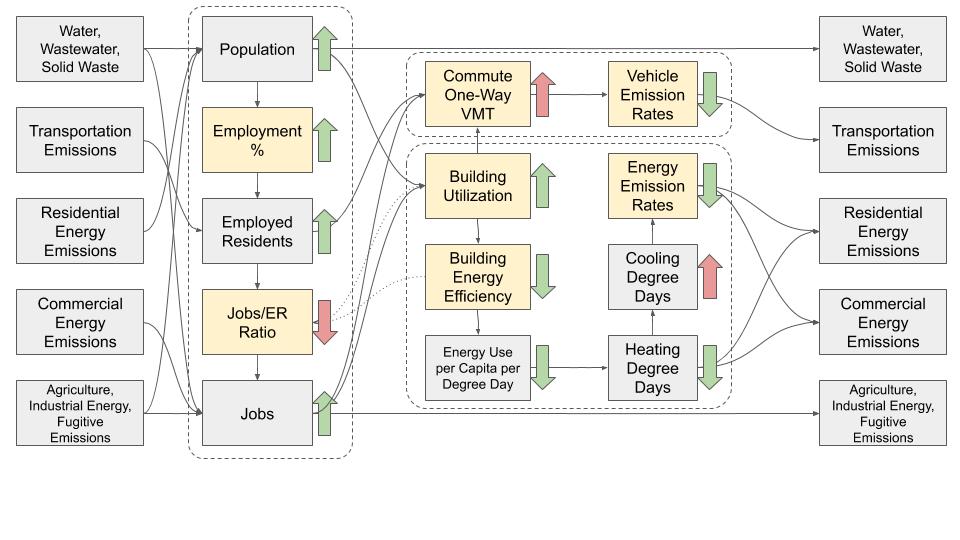
Figure 4.1: GHG model diagram.
\(~\)
- Employment % was observed in ACS data as the ratio between employed residents and population 16 and older. Using a simple linear assumption, the employment rate increases to 72% in 2040. As a point of comparison, the U.S. 2018 employment rate was ~ 70%. To maintain even this “business-as-usual” trend may depend on aggressive strategies like workforce training and education initiatives. Otherwise, this is considered a variable that can be influenced through specific employment growth strategies. Note that employment rate affects the number of employed residents, which particularly affects VMTs in the GHG model.
- Increasing Jobs to Employed Residents Ratio is different from increasing local employment rate as it can also include attracting workers who are not Stockton residents to commute to Stockton. Economic development strategies to attract new businesses would be an example of a type of strategy that influences the GHG model through this variable. J/ER affects the number of jobs in Stockton, which particularly affects commercial building emissions in the GHG model. If those local jobs are increasingly held by Stockton residents, it also implies that VMTs have been reduced.
- Commute One-Way Vehicle Miles Traveled is modeled using the LODES origin-destination data, so any predictions of changes in the distribution and concentration of jobs would affect this variable. Other transportation strategies such as increasing carpooling or transit ridership would also affect this variable.
- Vehicle Emission Rates is modeled based on EMFAC2017 projections of improvement in miles-per-gallon and EV adoption over the next two decades. Any active strategies to improve the fuel efficiency of Stockton commuter-owned vehicles and to increase EV adoption above expected rates would affect this variable.
- Building Utilization and Building Energy Efficiency are built into the variables of Energy Use per Capita per Degree Day as “hidden variables” that can’t easily be isolated without more data, but any strategies directed at reducing the amount of floor space per capita, or increasing floor area ratio on sites, or retrofitting buildings can be predicted as affecting Building Utilization or Building Energy Efficiency, which in turn would proportionally affect Energy Use per Capita.
- Energy Emission Rates also affect the ultimate emissions estimated out of some amount of energy use. We have already incorporated PG&E’s target to steadily eliminate the emissions associated with electricity use. Strategies that shift energy use from gas to electricity would result in quantitative changes at this leverage point in the model.